How the scoring rule shaped the ranking
Under the September rule, a likely monetized verdict needed a Join button. A Join button means the channel offers memberships, and YouTube offers channel memberships only in some locations. In a country that is not on that list, channels generally cannot offer memberships, so few of them can be rated likely monetized, whatever else they show.
This chapter checks how much of the September ranking that explains. Besides the snapshot it uses two files from analysis/2026-10-membership-rule/data:
the locations where YouTube Help listed channel memberships as available on 20 October 2026, and
the country table as we recomputed it on 19 October 2026, under the rule that also accepts a store or 100,000+ subscribers in place of the Join button.
from pathlib import Path

import matplotlib.pyplot as plt
import numpy as np
import pandas as pd

import plotstyle
from plotstyle import tidy

REPO = Path("..")
EXTRA = REPO / "analysis" / "2026-10-membership-rule" / "data"


def read(path):
    # keep_default_na=False: "NA" is Namibia's country code, not a missing value
    return pd.read_csv(path, keep_default_na=False)


september = read(REPO / "youtube-monetization-signals-by-country.csv")
october = read(EXTRA / "country-monetization-recomputed-2026-10-19.csv")
memberships = read(EXTRA / "youtube-channel-memberships-locations-2026-10-20.csv")
membership_codes = set(memberships["iso2"])
# YouTube Help listed 100 locations on 20 October 2026
assert len(membership_codes) == 100
assert len(september) == 50  # the text says "50 countries"


def add_shares(table):
    table = table.copy()
    table["memberships"] = table["country_code"].isin(membership_codes)
    table["likely_share"] = table["likely_monetized"] / table["channels_checked"]
    return table


september = add_shares(september)
october = add_shares(october)
print(f"September: {len(september)} countries; "
      f"October: {len(october)} countries, "
      f"{october['channels_checked'].sum():,} channels")
September: 50 countries; October: 51 countries, 4,382 channels
The bottom eight
# Same order as the previous chapter: by likely share, ties broken by sample size
ranked = september.sort_values(["likely_share", "channels_checked"]).iloc[::-1]
ranked = ranked.reset_index(drop=True)
without = ranked[~ranked["memberships"]]
with_memberships = ranked[ranked["memberships"]]
bottom = set(ranked.tail(len(without))["country_code"])
assert bottom == set(without["country_code"])
assert len(without) == 8  # the text of this chapter says "eight"
likely_without = int(without["likely_monetized"].sum())
checked_without = int(without["channels_checked"].sum())
WORDS = "zero one two three four five six seven eight nine ten".split()  # for the text

lowest_share = with_memberships["likely_share"].min()
lowest_with = with_memberships[with_memberships["likely_share"] == lowest_share]
lowest_label = (
    "The lowest country that does have memberships"
    if len(lowest_with) == 1
    else "The lowest countries that do have memberships"
)
print("without memberships:", ", ".join(without["country"]))
print(f"best of them {without['likely_share'].max():.1%}; "
      f"lowest with memberships: {' and '.join(lowest_with['country'])} "
      f"at {lowest_share:.1%}")
without memberships: Russia, Sri Lanka, Iraq, Azerbaijan, Pakistan, Bangladesh, Tanzania, Kazakhstan
best of them 8.3%; lowest with memberships: Malaysia and India at 13.3%
Eight of the 50 countries are not on YouTube’s memberships list: Russia, Sri Lanka, Iraq, Azerbaijan, Pakistan, Bangladesh, Tanzania, Kazakhstan. They are exactly the bottom eight of the September ranking. The best of them had 8.3% of its channels rated likely monetized. The lowest countries that do have memberships, Malaysia and India, had 13.3%.
The floor is not quite zero: 14 of the 480 channels checked in those eight countries were rated likely monetized, which under the September rule means each showed a Join button. We have not looked into why those few could offer memberships.
Source
order = ranked.iloc[::-1].reset_index(drop=True)  # lowest first: y = 0 is the bottom row
y = np.arange(len(order))
colours = np.where(order["memberships"], plotstyle.MEMBERSHIPS, plotstyle.NO_MEMBERSHIPS)

fig, ax = plt.subplots(figsize=(8, 12.5))
ax.hlines(y, 0, order["likely_share"], color=plotstyle.GRID, lw=1, zorder=1)
ax.scatter(order["likely_share"], y, s=42, c=colours, edgecolors=plotstyle.SURFACE, linewidths=1.5, zorder=3)
ax.set_yticks(y, order["country"], fontsize=8.5)
ax.set_ylim(-0.8, len(order) - 0.2)
ax.set_xlim(-0.012, 0.55)  # a little room so dots at 0% are not cut
ax.xaxis.set_major_formatter(plotstyle.PERCENT)
ax.xaxis.set_ticks_position("top")
ax.grid(axis="x", color=plotstyle.GRID, lw=0.8)
tidy(ax)
ax.spines["bottom"].set_visible(False)
ax.axhline(len(without) - 0.5, color=plotstyle.INK_MUTED, lw=0.8, ls=(0, (3, 3)))
ax.text(0.54, (len(without) - 1) / 2, f"No channel memberships\nin these {WORDS[len(without)]}", ha="right", va="center",
        fontsize=9, color=plotstyle.INK_SECONDARY)
fig.suptitle("Likely monetized share, September 2026 rule", x=0.02, ha="left", fontsize=13, fontweight="semibold")
fig.text(0.02, 0.958, "Colour: whether YouTube offers channel memberships in the country (YouTube Help, 20 October 2026).",
         fontsize=9, color=plotstyle.INK_SECONDARY)
fig.legend(
    handles=[
        plt.Line2D([], [], marker="o", ls="", color=plotstyle.MEMBERSHIPS, markersize=7, label="Memberships offered"),
        plt.Line2D([], [], marker="o", ls="", color=plotstyle.NO_MEMBERSHIPS, markersize=7, label="Not offered"),
    ],
    loc="upper left", bbox_to_anchor=(0.015, 0.948), ncol=2, frameon=False, fontsize=9,
)
fig.tight_layout(rect=(0, 0, 1, 0.94))
plt.show()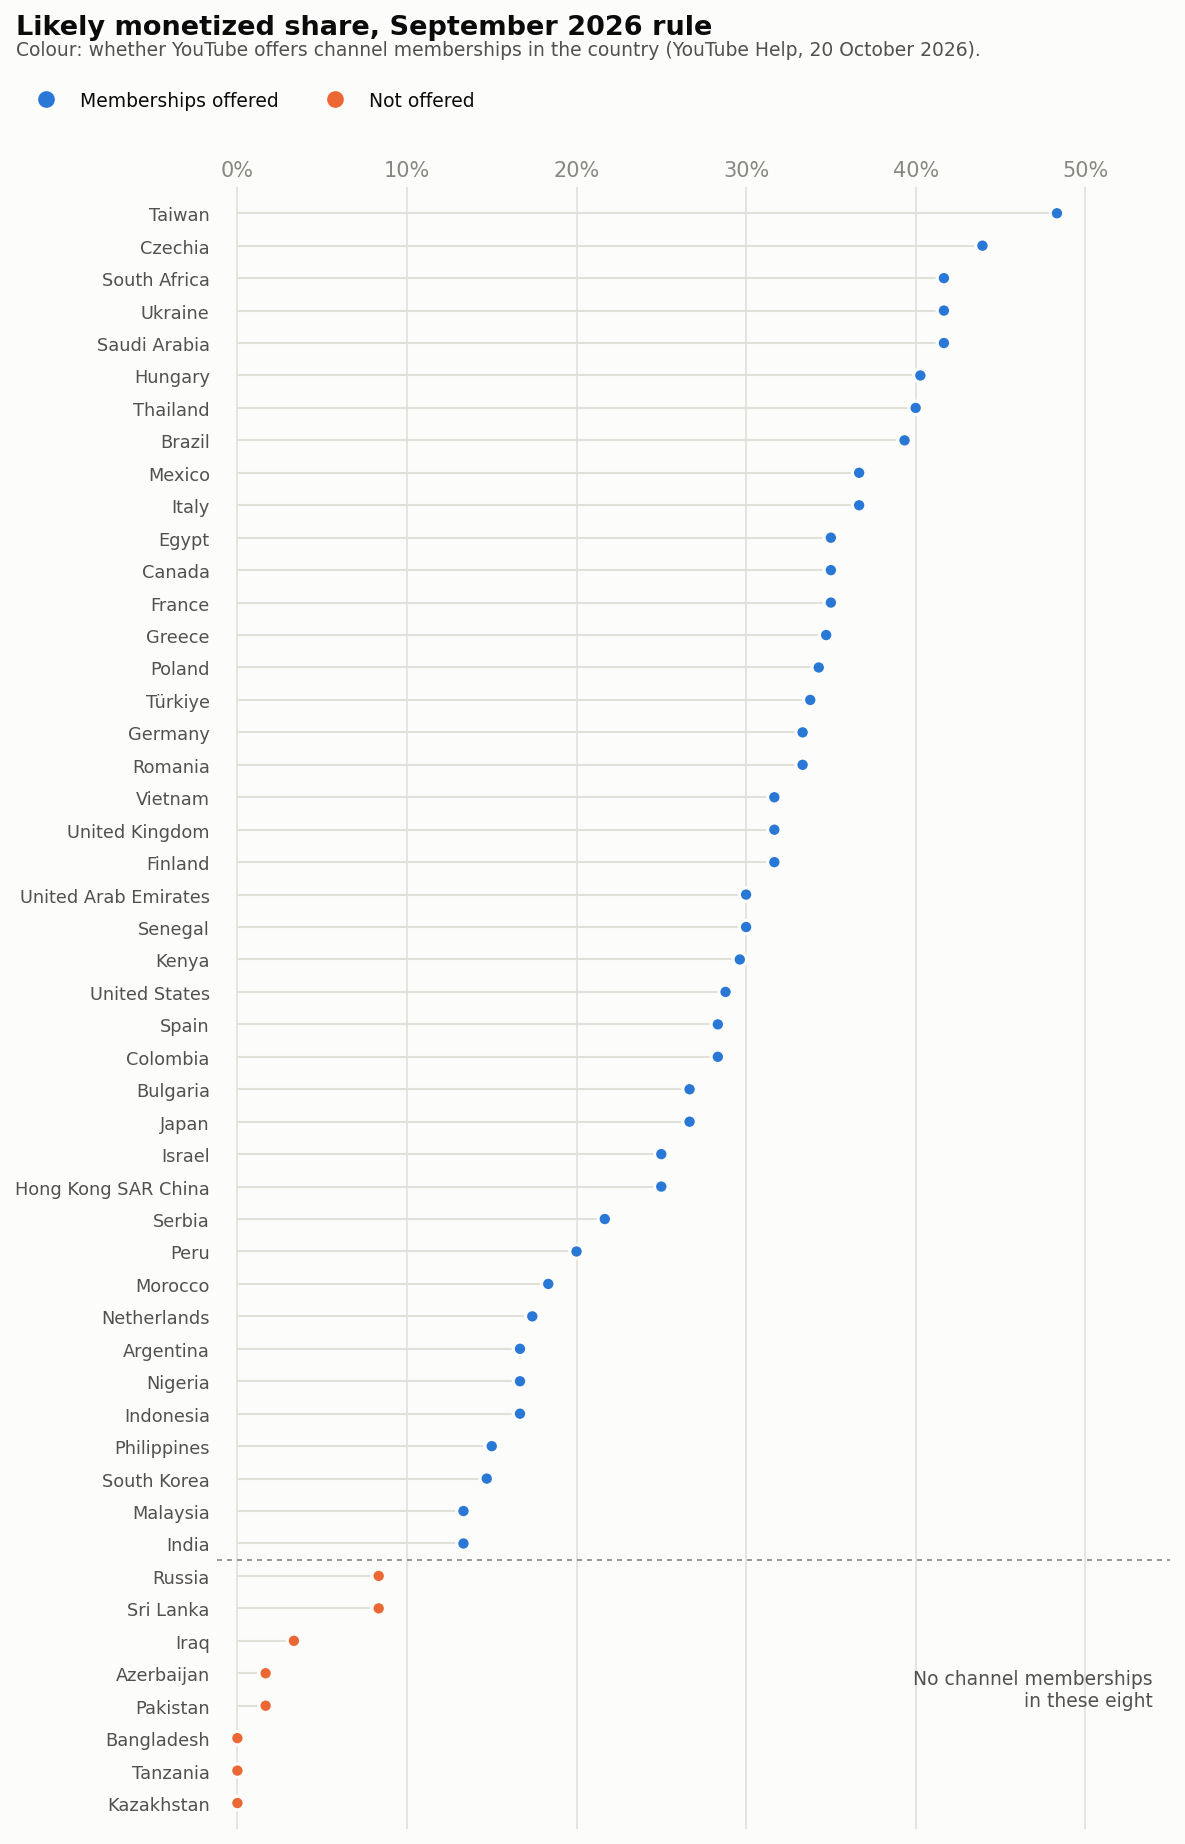
counts = ["channels_checked", "likely_monetized"]
totals = september.groupby("memberships")[counts].sum()
pooled_share = totals["likely_monetized"] / totals["channels_checked"]

# How much of the variation in the likely share across countries the yes/no
# memberships split accounts for (1 minus within-group / total sum of squares)
share = september["likely_share"]
group_mean = september.groupby("memberships")["likely_share"].transform("mean")
within_groups = ((share - group_mean) ** 2).sum()
overall = ((share - share.mean()) ** 2).sum()
explained = 1 - within_groups / overall
print(f"pooled likely share: with {pooled_share[True]:.1%}, "
      f"without {pooled_share[False]:.1%}; explained {explained:.1%}")
pooled likely share: with 29.6%, without 2.9%; explained 56.7%
Pooled, the 42 countries with memberships had 29.6% of their channels rated likely monetized, the eight others 2.9%. That single yes-or-no fact about each country accounts for 57% of the variation in the likely monetized share across all 50 countries.
Nearly the same channels, new rule
The October table re-scored every stored check under the revised rule, where a Join button, a store, or 100,000+ subscribers can each complete a likely monetized verdict. It also contains channels that people looked up on MonetizationKit after September, so not every row is the same sample. To compare like with like, the next cell keeps the countries whose channel count changed by six or fewer, so that about 90% or more of each row is the September sample scored again.
both = september.merge(october, on="country_code", suffixes=("_sep", "_oct"))
both["channel_change"] = (
    both["channels_checked_oct"] - both["channels_checked_sep"]
)
same_sample = both[both["channel_change"].abs() <= 6].copy()
same_sample["rise"] = (
    same_sample["likely_share_oct"] - same_sample["likely_share_sep"]
)

by_group = same_sample.groupby("memberships_sep")[
    ["likely_share_sep", "likely_share_oct", "rise"]
].mean()
same_without = int((~same_sample["memberships_sep"]).sum())


def rank_correlation(a, b):
    """Spearman's rho: Pearson on average ranks, so no SciPy is needed."""
    return float(np.corrcoef(pd.Series(a).rank(), pd.Series(b).rank())[0, 1])


rho_same = rank_correlation(
    same_sample["likely_share_sep"], same_sample["likely_share_oct"]
)
iraq = both.set_index("country_code").loc["IQ"]
tanzania = both.set_index("country_code").loc["TZ"]
group_names = {True: "memberships offered", False: "not offered"}
by_group.rename(index=group_names).style.format("{:.1%}")The filter keeps 28 countries, six of them without memberships. In those six, the average likely monetized share went from 3.6% to 52.7%. Membership countries rose as well, from 31.4% to 59.0%, because stores and large channels now count everywhere. Iraq went from 2 to 40 likely monetized channels out of 60, Tanzania from 0 to 35 out of 60.
Source
fig, ax = plt.subplots(figsize=(7.5, 7.5))
for _, row in same_sample.sort_values("memberships_sep", ascending=False).iterrows():
    offered = row["memberships_sep"]
    ax.plot(
        [0, 1],
        [row["likely_share_sep"], row["likely_share_oct"]],
        color=plotstyle.MEMBERSHIPS if offered else plotstyle.NO_MEMBERSHIPS,
        lw=1.2 if offered else 2,
        alpha=0.45 if offered else 1,
        marker="o",
        markersize=4 if offered else 6,
        markeredgecolor=plotstyle.SURFACE,
        zorder=2 if offered else 3,
    )
labelled = same_sample[~same_sample["memberships_sep"]].sort_values("likely_share_oct")
label_y = labelled["likely_share_oct"].to_numpy().copy()
for i in range(1, len(label_y)):  # nudge labels apart so they never overlap
    label_y[i] = max(label_y[i], label_y[i - 1] + 0.024)
for (_, row), y_text in zip(labelled.iterrows(), label_y):
    ax.text(1.05, y_text, f"{row['country_sep']}  {row['likely_monetized_sep']} to {row['likely_monetized_oct']} of {row['channels_checked_oct']}",
            va="center", fontsize=8.5, color=plotstyle.INK_SECONDARY)
ax.set_xticks([0, 1], ["September rule\n(Join button required)", "October rule\n(Join, store or 100k+ subscribers)"])
ax.set_xlim(-0.15, 1.8)
ax.set_ylim(-0.02, 0.85)
ax.yaxis.set_major_formatter(plotstyle.PERCENT)
ax.grid(axis="y", color=plotstyle.GRID, lw=0.8)
tidy(ax)
ax.spines["bottom"].set_visible(False)
ax.set_ylabel("Share rated likely monetized")
ax.legend(
    handles=[
        plt.Line2D([], [], color=plotstyle.MEMBERSHIPS, lw=1.5, label=f"Memberships offered ({len(same_sample) - same_without} countries)"),
        plt.Line2D([], [], color=plotstyle.NO_MEMBERSHIPS, lw=2, label=f"Not offered ({same_without} countries)"),
    ],
    loc="upper left", frameon=False, fontsize=9,
)
fig.suptitle("Same countries, new rule", x=0.02, ha="left", fontsize=13, fontweight="semibold")
fig.text(0.02, 0.925, f"{len(same_sample)} countries whose sample changed by six channels or fewer between the two tables",
         fontsize=9, color=plotstyle.INK_SECONDARY)
fig.tight_layout(rect=(0, 0, 1, 0.92))
plt.show()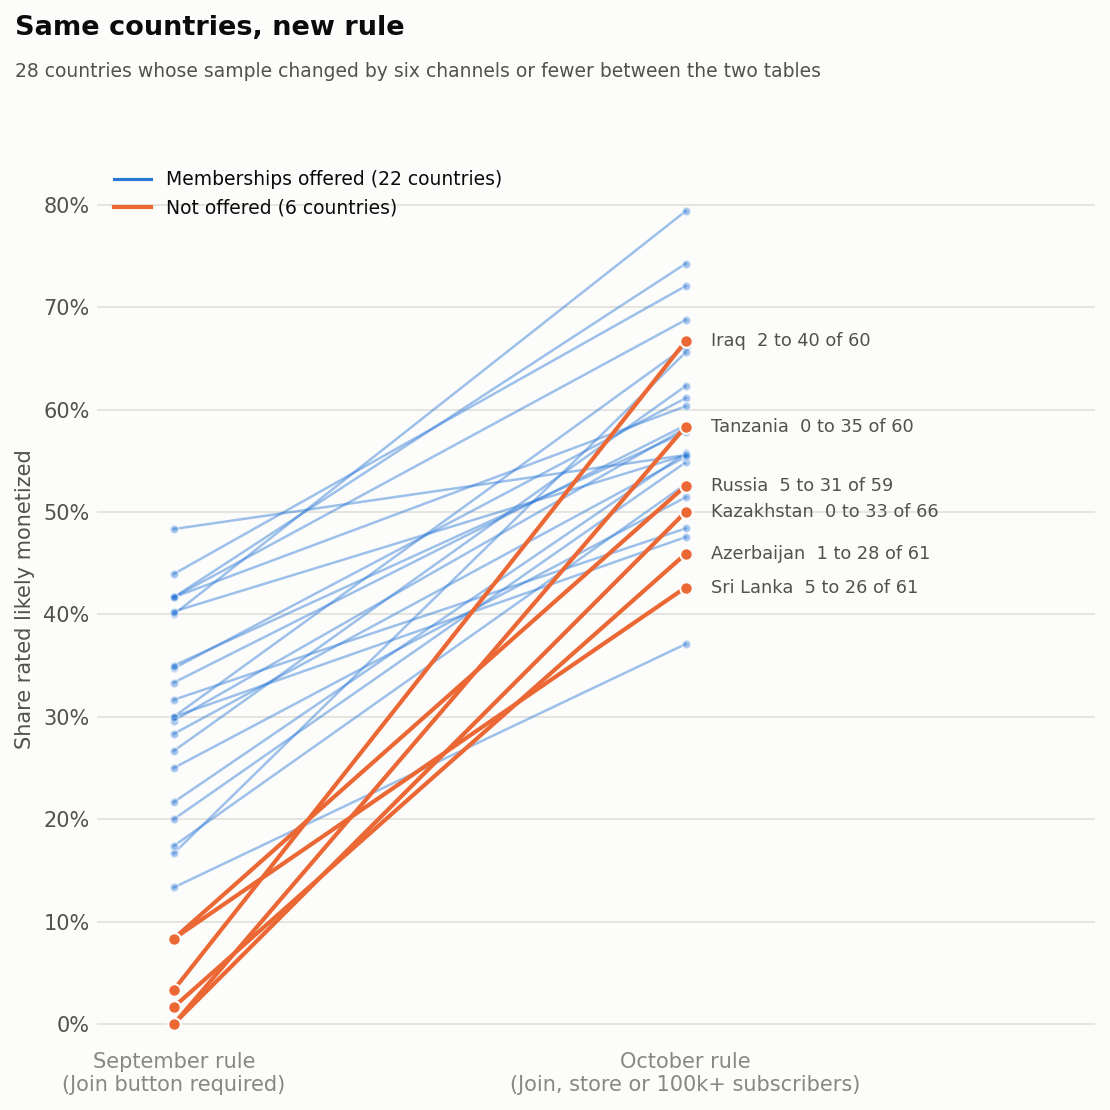
october_ranked = october.sort_values("likely_share", ascending=False)
october_ranked = october_ranked.reset_index(drop=True)
october_ranked["rank"] = october_ranked.index + 1
ranks_without = october_ranked.loc[~october_ranked["memberships"], "rank"]
top10_september = set(ranked.head(10)["country_code"])
top10_october = set(october_ranked.head(10)["country_code"])
top10_both = len(top10_september & top10_october)
print(f"October ranks of the eight: {ranks_without.min()} to "
      f"{ranks_without.max()} of {len(october)}; top-10 overlap {top10_both}; "
      f"rank correlation (same sample) {rho_same:.2f}")
October ranks of the eight: 6 to 48 of 51; top-10 overlap 4; rank correlation (same sample) 0.49
In the full October table of 51 countries, the eight countries without memberships rank between 6 and 48 instead of filling the last eight places. Only four of the September top ten are still in the October top ten, and the rank correlation between the two rules, over the same-sample countries, is 0.49. The order of countries in the September table owed a good deal to the scoring rule.
What to take from this
A missing signal is only evidence where the signal could have appeared. Channel memberships, stores and the Partner Program itself are not offered in every country, so a comparison between countries that leans on them has to check availability first. The September snapshot stays on Zenodo as it was published; read its bottom eight rows with this chapter in mind. The live table on MonetizationKit uses the October rule.
The folder analysis/2026-10-membership-rule in the repository has a longer version of this analysis, with a simulation of how much spread sampling noise alone would produce.